Statistics on voting and representation in Russia
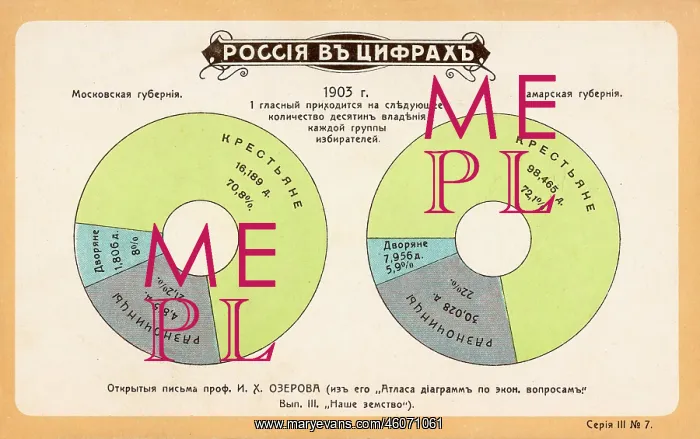
Statistics in the form of two pie charts, showing voting and representation in 1903 in the Moscow and Samara administrative regions (Guberniya), based on an economic atlas published by Professor I Kh Ozerov. The green sections represent farm labourers/peasants, grey represents Raznochintsy (ordinary people who pay personal taxes), and blue represents the nobility/owners of property. The number of elected representatives (Glasniy) is shown in terms of land acreage and numbers of voters
Picture No
10289771
Media ID
46071061
Size
4880px x 3064px
(1.6MB)
Credit
Mary Evans / John Massey Stewart Collection
Source
Russian postcard, Moscow
Date
1903
Pick your License
Administrative Atlas Charts Classes Councillors Districts Elected Electorate Labourers Landowners Nobles Owners Ozerov Peasants Regions Samara Statistics Status Taxes Voters Voting
Features In These Collections
> Contributors > JMS